Your organization may be engaged in various digital marketing efforts, but are you tracking their results efficiently and consistently? From email campaign link clicks to website traffic sources, there are a variety of key performance indicators that are critical to keeping a pulse on to ensure your investments are seeing conversions at an optimized rate. When you have many digital marketing sources with different KPIs and platforms to track in, it can be challenging to monitor them in a streamlined fashion that is digestible for all stakeholders.
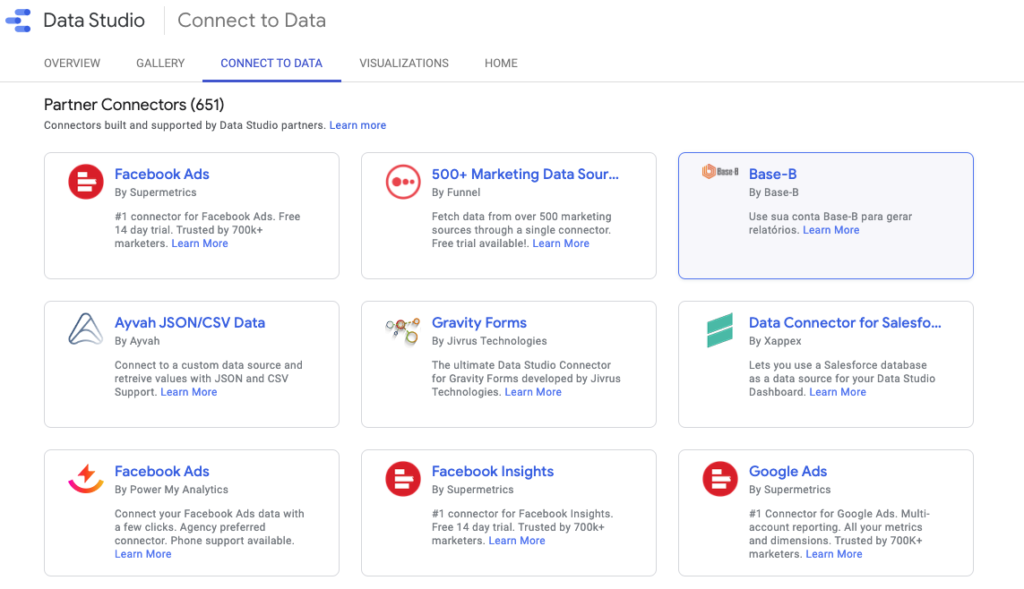
Enter Looker Studio (formerly Data Studio), a free tool that enables your organization to leverage data from various sources in a user-friendly, easy-to-digest fashion. Data from sources like Google Analytics, LinkedIn, Facebook, Instagram, MailChimp, and HubSpot can be integrated into a customized Data Studio dashboard through connectors. Connectors are pre-built by Google and other developers and funnel underlying data from your digital marketing sources to your Looker Studio dashboard. With this functionality, Google Looker Studio is a great platform to keep tabs on the KPIs for most, if not all, of your digital channels.
Sounds awesome, doesn’t it? Let’s jump into three essential things you need to know to start utilizing Looker Studio effectively.
1. The platform pulls from both Google-hosted and non-Google-hosted platforms
Regarding your marketing goals, it’s important to utilize resources to monitor your campaigns, progress, and content. With the data, you can determine what’s working in your campaign or social strategy and what isn’t, allowing you to adjust your strategy and not waste your resources on content that isn’t resonating with your audience.
Google offers many connectors that you can use to streamline data from their supported platforms to your dashboard for free. This includes data from places like Google Analytics, Google Ads, Google Sheets, YouTube Analytics, Search Console, and more. Often with these connectors, anything you see that is reported in the native platform can be organized and reported in Looker Studio. That means easy reporting in one place for things like website traffic sources, your top searched pages, and posted videos.
Many third-party companies, like Supermetrics and Reporting Ninja, have created their own connectors that you can use at a cost for other digital platforms not supported by Google. Keep in mind that the kind of reporting you get with these connectors can vary, so if you’re looking to invest in some, always opt for a free trial when available before paying so you can see what limitations there are, if any.
A workaround if you don’t want to pay for third-party connectors (or there are none available for your given platform) is to export and input your data into Google Sheets, which is always free to connect to Looker Studio. The largest drawback to this method is the manual work that goes into moving data into and updating a Sheet. With that said, if reporting on all your digital channels in one place is important, leveraging Google Sheets can be most beneficial.

2. You can design your dashboards to fit your brand and unique KPIs
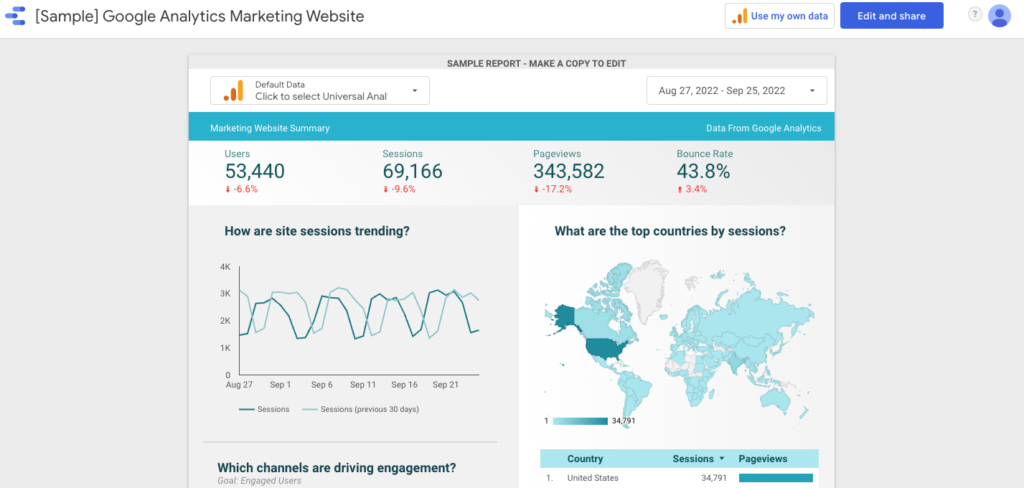
Although your dashboard may start with default colors and styling from Google, the sky’s the limit with how you can design it! Google offers many premade themes and layouts but also gives you the flexibility to add your own colors. There are many options to alter the “style” of the data you’re reporting to fit your brand’s image better.
With any given metric, Looker Studio gives you a range of options on how you can present the information. You can format scorecards, bar charts, sparklines, pie charts, and much more.
Google and Supermetrics have a wide range of templates to leverage their own connectors to give you a good representation of your design capabilities.

3. You can customize data freshness for your metrics
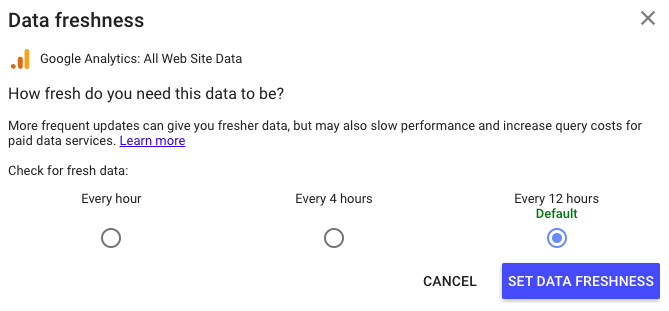
Although you can’t see your data reporting live like what you’d see on Google Analytics Real-Time reporting page, depending on the connector, data is refreshed regularly so that you’re getting the most relevant insights for it in a given period (did we mention period reporting is customizable too?)
For most connectors offered by Google, you can set the rate of “data freshness” you want to receive. The default data freshness is typically 12 hours but can be set to as short as every hour.
Keep in mind that if you’re paying for third-party connectors, the cost may only permit data freshness to be in specific durations.

Although this is just the tip of the iceberg with Looker Studio, these insights should set you up for success when starting on the platform to streamline your digital channel KPI reporting! Google Looker Studio offers significant value as a free-to-use, intuitive platform that can streamline your digital marketing data reporting in a digestible format for yourself and your stakeholders.
Want a more robust tutorial on leveraging Looker Studio for your organization? You can take a free course offered by Google here.

